2023-08-07 · NaI, 45 mm puck, fully recessed · 48 mm × 6 in quartz · flame downward, 3-GPN-4 · fuel 3.5 LPM, O₂ 9 LPM · co-temporal LS-100 luminance (0.275 ND) + USB2000 spectra, 207 acquisitions over 545 s
claim-status ledger
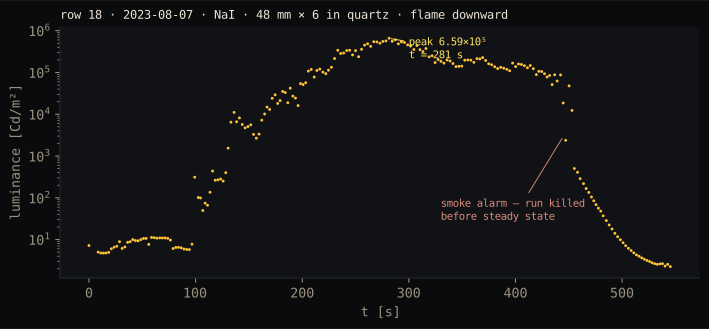
establishedrow 18 = the 16:20:32 NaI run; peak luminance 659,273 Cd/m² at t = 281 s — the logbook's all-time record. Self-reversed D-doublet with two horns, K 766 and Na 819 present, total exitance 5.6 suns.signal observedthe 589 system is super-Planckian for every energetically allowed emitter temperature — μ_γ = +0.1 to +1.0 eV across the band from bulk T_g to the adiabatic ceiling [re-inverted | T_emitter] — and μ_γ(t) stays above zero for ~150 s (37 acquisitions), ending only at termination.theoryμ_γ is pinned by the recombination affinity of the thermolysis-clamped radical pool (Cantera: A(H+H→H₂) ≈ 0.4–1.4 eV along the cooling path) — the measured μ window agrees. Ceiling is fuel-cell class, not Carnot.opentrue emergent 589 core width — bounded by measured atomic physics: doppler 0.004 nm ⊕ lorentz 0.012–0.035 nm at 1 atm; the slider spans the physical range only · instrument spectral response (NIR bands are lower bounds) · steady state was never reached — the run died on a smoke alarm.
the lab — drag the assumptions
the measured run underneath; your assumptions on top. Planck emittance drawn live at your Tkin — where the data pokes above it, the light is not thermal.
T_kin2800 K
true 589 width0.030 nm
……
measured spectrum (t = 281 s) vs Planck(T_kin)
dashed: blackbody emittance Bλ at your T_kin. teal marker: the 589 core deconvolved at your width — the slit smears peaks, not integrals. log scale.
assumption space — click / drag to move the operating cell
μγ from the resolution-free 589 band integral (780 W/m²/sr). The crosshair is your current cell; it drives the other two panels. Sub-Planckian survives only in the top-right corner.
μγ(t) at your assumptions
207 co-temporal acquisitions recomputed live. Push T_kin up or width right and the driven plateau sinks; the data resists.
luminance vs time. Ignition ~100 s, record peak at 281 s, plateau — then a smoke alarm killed it before steady state. Every number on this page is therefore a floor, not a ceiling.
audit table
589 width
T_kin 3100 K
T_kin 2800 K
2.0 nm (fully smeared)
0.61× sub
1.42× SUPER
1.0 nm (D-doublet span)
1.22× SUPER
2.83× SUPER
0.6 nm
2.03× SUPER
4.72× SUPER
0.2 nm (Voigt core)
6.10× SUPER
14.2× SUPER · μ = +0.64 eV
control — the HPS lamp, corrected
the frame: μ is reservoir-relative; nothing is μ = 0. The right baseline: an ohmic-pumped emitter (heat first, then thermal excitation) holds μ ≈ 0 relative to its local plasma temperature; a chemically-pumped one can exceed it. The discriminating contrast: brightness temperature vs local matter temperature, each device in its own frame. measured (2023-10-24, this bench; shape-only — no luminance logged):
HPS arc — horns 584.7/596.3 (11.6 nm apart), horn/dip 12.7, wings fat (610 nm at 0.62 of peak), 819/589 = 0.50: the textbook deeply-trapped thermal profile, fully accounted by a temperature gradient (de Groot & van Vliet).
row 18 — horns 587.9/590.3 (2.5 nm), horn/dip 1.38, wings thin (610 nm at 0.14), 819/589 = 0.084: shallow trapping, different regime. The μ > 0 finding does not lean on extreme trapping — it rests on the absolute band integral at shallow trapping, where a thermal emitter would be weakest. absolute baseline (L = 6×10⁶ Cd/m² after ND filter — hard-won):
calibrated HPS spectrum: total exitance 51.5 suns; every feature T_b = 1814–2803 K, all below arc temperature (≈4000 K); μ vs T_arc = −0.9 to −2.1 eV everywhere in the profile. The ohmic lamp: brightness capped by the coldest τ = 1 layer — the heat-then-excite signature, measured.
row 18, same ledger: 589 band μ > 0 for every allowed emitter temperature (+0.09 to +0.95 eV across the band) vs T_kin = 2800–3100 K; horns T_b 2463 K, already within ~350 K of T_kin even at instrument smear. both sides now measured in their own frames: lamp negative everywhere, flame positive at the driving line.
(caveat: HPS luminance and spectrum from different sessions; a 3× scale error moves μ by only ~0.3 eV — nowhere near a sign flip.)
the reference temperature, measured — no assumed T_kin
the audit's T_kin was an assumption swept over 2400–3400 K (design value + latent-heat argument), never a measurement. Two measured bounds replace it: the spectrum's own thermal floor (same acquisition): 610 nm → T_b 1957 K · 660 → 1668 K · 700 → 1535 K · 750 → 1439 K · 900 → 1216 K. The local thermal bath along the line of sight radiates at ~1400–2000 K. The 589 band: effective T_b = 2916 K even at fully-smeared 2.0 nm width (3180 K at 1.0, 3407 K at 0.6). The line outshines the local thermal floor by ~1000–1500 K with no assumed temperature anywhere. (If part of the floor is itself chemiluminescent continuum, the anomaly is larger, not smaller.) the wall limit: the quartz survived — fused-silica softening ~1940–2000 K bounds the wall; the floor T_b values sit consistently below it. The 589 band at ≥ 2916 K effective brightness is ~1000 K above any wall-compatible temperature. T_kin now enters only for kinetics (quenching, rates), not for the existence of the super-thermal component.
the closure: three measurements, two unknowns
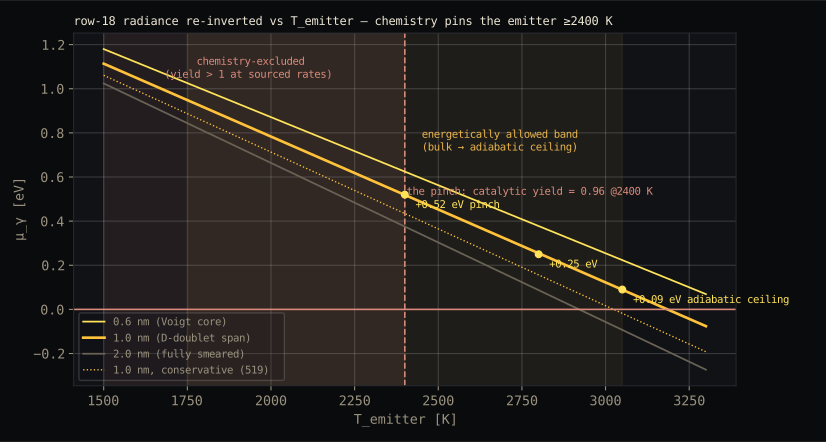
the measured 589 radiance re-inverted at every candidate emitter temperature. The strong claim: μ > 0 for the entire energetically allowed band — the fully-smeared worst case (2.0 nm) crosses zero only at 2918 K, above the plausible kernel range.
[inverted: single-point — one spectrum, one assumed T_emitter; NOT a constant across conditions]
p_esc (D-line escape fraction)
4.7×10⁻³ — T-independent
[reconstructed | T_emitter]
implied V from μ
61 cm³ vs 50 geometric — inside band
[consistency check]
catalytic cycle (NaOH+H, NaH+H)
k1 = 1.5×10⁻¹⁰ [T — Martin et al. 2017]; k2 = 6.7×10⁻³¹ [T-family — Hynes et al. 1984]
[sourced]
per-cycle electronic yield (reconstructed)
0.21 @2800 K · 0.96 @2400 K · >1 below 2400 K — the pinch
[reconstructed | sourced rates]
decoupling: quench (1.3×10⁷/s) ≫ escape (A_D·p_esc = 2.9×10⁵/s), so μ is a pure pump/quench ratio (β from μ) and the D-line power is set by p_esc alone (radiance constraint). First law honored: pump is exergy-limited, P_line ≈ 12–40 W ≪ β·P_fuel.
queued: the two-zone kernel energy balance that PINS T_emitter; the catalytic-cycle pump (NaOH+H, NaH+H — Na as recombination catalyst, cycle throughput ≫ chaperone statistics; β becomes per-cycle electronic yield) replacing β×P_fuel.
consistency: one state vector, one solver
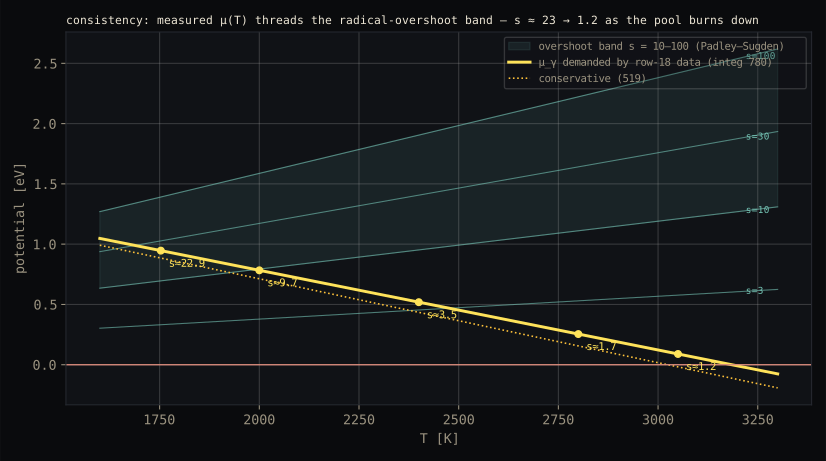
measured μ(T) descending the overshoot fan: implied s ≈ 23 (1753 K) → 1.2 (3050 K) — threading the measured Padley–Sugden flame-front band (s = 10–100) at the cold end, relaxing toward equilibrium downstream. Chemistry and photometry in the same state space.
one state vector per zone: (T_bath, p, overshoot s = [H]/[H]_eq, full Na speciation). A_HH = 2kT ln s exactly [asserted in code, total-mole correction included]. NESS rates carry detailed balance: thermal excitation = k_q·g·exp(−E/kT) — reverse of quench, so chemistry off ⇒ μ → 0⁻, not −∞; pump forward/reverse = exp(A/kT). Theorem exhibited: μ_γ ≤ A [asserted]. The lumped NESS is a 2-level special case of opencretin's cr_kernel statistical-equilibrium solver — validated against cr.wasm to 4 digits. Potentials cross-checked vs opencretin gibbs_table.json (JANAF-validated): free Na 0.524 vs 0.536 at 2800 K, seed 0.02.
provenance: flasmon/consistency.py, cr_ness.py · opencretin/engine/cr_kernel.zig, cr.wasm, gibbs_table.json · sites/dyson-cylinder/radicals_table.json (extended 900–4000 K table; low-P rows flagged not_converged by the memory ledger — avoided).
live: drag the inversion
T_emitter2400 K
589 width0.030 nm
……
the measured 589 radiance re-inverted live (row18-kernel.wasm). Shaded: chemistry-excluded (T < 2400 K, catalytic yield > 1). Drag to the adiabatic edge — μ stays positive across the whole allowed band at 1.0 nm.
the standard configuration — night shift, deadline build
chemistrythe pinch: the catalytic cycle (Na as recombination catalyst, not consumable) at sourced rates requires per-cycle electronic yield 0.21 at 2800 K, 0.96 at 2400 K — and >1 below 2400 K. The emitter is pinned ≥2400 K, from the chemistry side — landing exactly on the swirl design point. The excluded cold end is shaded on the μ(T) curve above. [reconstructed | sourced rates: Martin 2017, Hynes 1984]salt loopclosed wicking film, steady state: circulation 0.19 mg/s, vapor pressure sump-set (feed-independent), X_core = 2.4×10⁻³, film δ to 649 µm at the cold end; duty split evaporation 2322 W / condensation 2862 W / sensible 351 W (stream-capacity capped, [MODEL ×3]). Latent heat is a loan the condenser repays; makeup = carryover only.PV ledgerfuel → μ → photons → W_e — three-way split, r2 matrices [tie-out resolved]: 550 W radiated → 0.847 PV-electrical (middle-14 facet slabs; verified byte-level) → η_mono(Na 589, 60 °C) = 0.255 [derived: EQE 0.99 [T NREL/SPWR 2013] × diode theory; FF 0.80 MODEL] → 119 W_e = 5.7% fuel-to-electric at 2.1 kW fuel; 0.080 header-thermal — absorbed in the 76 mm header/plenum bands, NOT pure loss: the header sits on the feed path, so its absorption is a recuperation preheat credit [DESIGN: HEX-CELL.md:18]; residuals 0.037 quartz + 0.036 caps. At the 7-sun point (7,470 W radiated, 60 mm apothem): 1.6 kW_e (Na line) / 2.2 kW_e (K line, η_mono 0.352) + 598 W header credit. design lever, surfaced not buried: if Maxeon coverage extends into the header bands, electrical capture rises 0.847 → 0.927 — +9.4% relative — a real trade of cell area against manifold packaging, awaiting your call.openTPMS end caps: flat 776 W → 1810 W/cap at 1200 K (ρ_eff = 0.7 [MODEL], coupon owed). Cl scavenging ≤ 1.04% worst case — not material. Static merge closure 1.000000 on r2. Transient film path now semi-implicit (no NaN), presented artifact remains the steady solve.
what would change our mind
0.1-nm-class D-doublet spectrumthe true 589 core width + horn/dip profile, co-spatial with luminance. Moves the μ sign at the band's edge — the for-all claim survives or dies here first.819 nm Doppler widththe thin line's undistorted width = independent T_emitter. Moves the T axis of every inversion on this page (never population-ratio thermometry in a driven medium).K-line VCSEL absorptiondensitometer for the alkali column independent of trapping. Moves n_Na, hence p_esc and the reconstructed yield.coupon ρ_eff (TPMS caps)measured diffuse reflectance of the real cap material. Moves the cap-glow and integrating-sphere recycling numbers (currently [MODEL] pore-bounce ρ⁴).k3 (NaH + H) ratethe cycle's closing step. If slower than [ESTIMATE], the chemistry pinch moves hotter; if faster, the allowed band reopens below 2400 K.
method and caveats
data: dropbox/Experiments/2023 8 7 16 20 32 …/ — 1.txt luminance (LS-100, 0.275 ND filter, corrected in logger), 2.txt wavelength grid (0.35–0.38 nm/px), 3.txt spectra, timestamps verified co-aligned row-by-row. calibration: per-acquisition photometric scale; integrals are resolution-conserved. NIR (766, 819) not corrected for instrument response — lower bounds. resolution: instrument FWHM ≈ 1.4–1.8 nm (K-doublet fit 1.82; 819-blend variance 1.79 — both upper bounds). Observed 589 horns are slit-dominated: true horns ~0.3–1.0 nm, true horn brightness ≈ 2–4× measured, i.e. T_b(horns) ≈ 2800–3300 K against T_kin — the decisive number sits on the boundary. The μ > 0 finding rests on the resolution-free band integral, not on resolved peak heights. analysis: flasmon/row18_raw.py, row18_audit.py, affinity_scan.py (Cantera gri30), make_figures.py, row18_kernel.zig (WASM, verified against the python reference) — all in the cc repo. decisive next measurement: 0.1-nm-class D-doublet spectrum, co-spatial luminance, run to steady state, non-sodium T_kin diagnostic. Line to beat: B₅₈₉ = 635 W/m²/nm/sr (Planck at 3100 K).